Updated this month
Quick answer
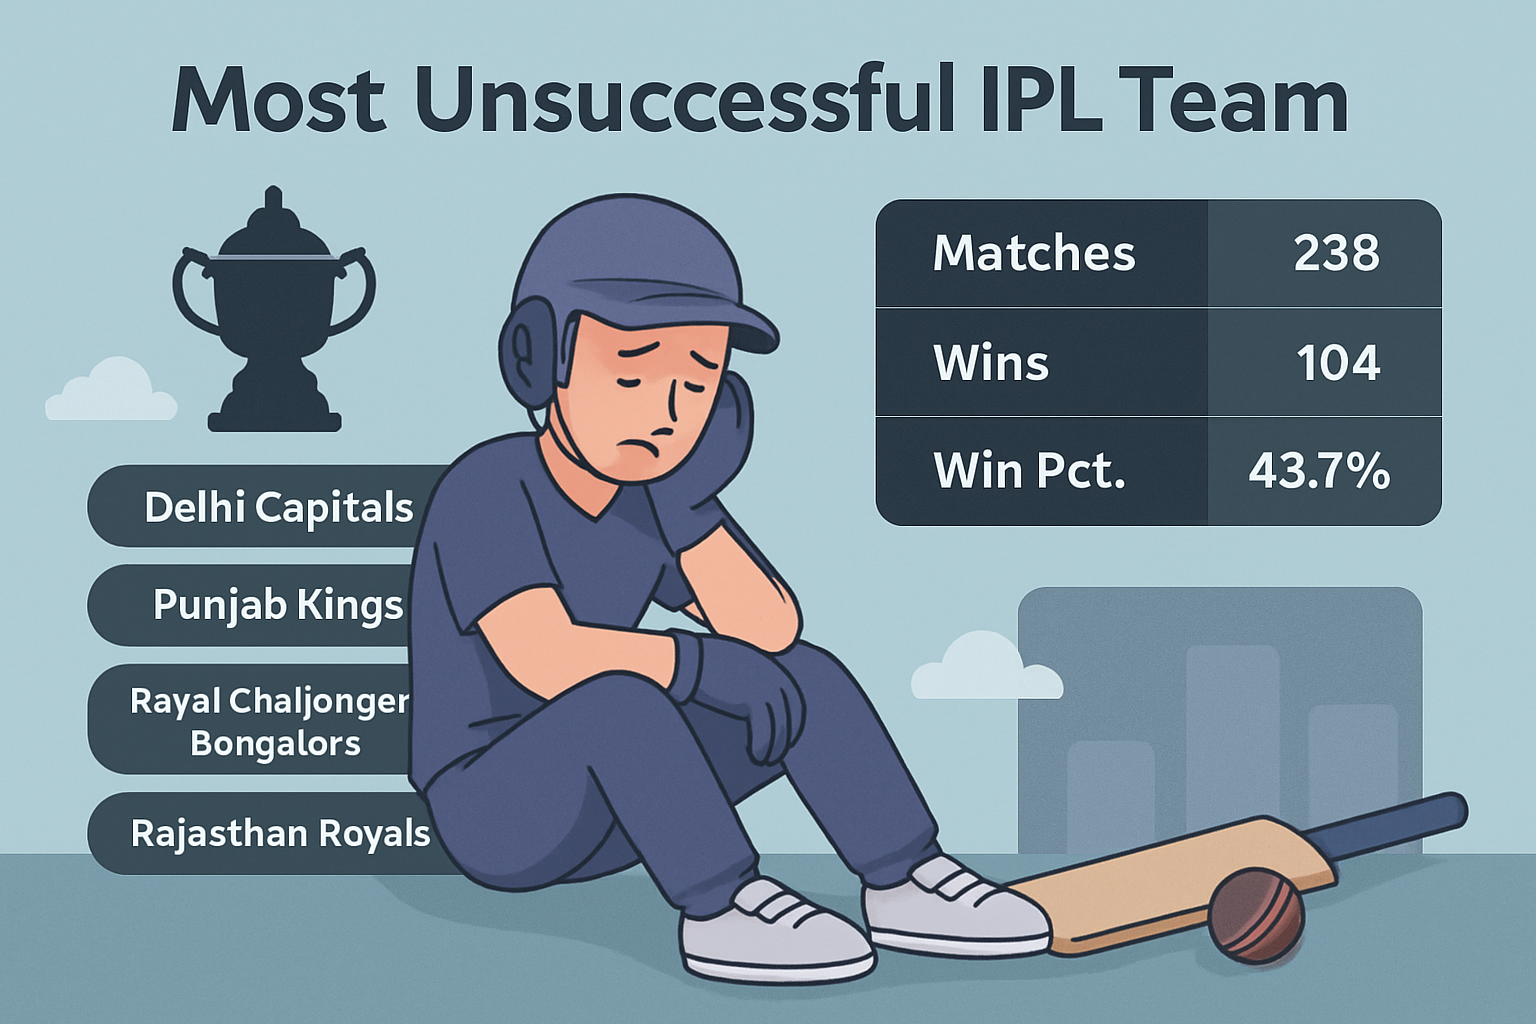
Using a composite, data-led Unsuccess Index for active franchises with at least one hundred matches played, the most unsuccessful IPL team is Punjab Kings. They remain trophyless, have one of the lowest win percentages among long-term franchises, a high tally of all-time losses, and multiple last-place finishes. Delhi Capitals sit close behind on almost every metric. Among defunct teams, Pune Warriors are the clear outlier for sustained underperformance.
Introduction: the truth about “unsuccessful” in the IPL
Every league has its mythology. In this one, the word unsuccessful does far more work than a win-loss column. It wraps heartbreaks, near-misses, chaotic auctions, captaincy churns, and tactical blind spots into one label. It’s the fan standing through the last over, hand on heart, second-guessing a bowling change. It’s a pit in the stomach when a top-order collapse unfolds for the third time in a week. Unsuccessful in the IPL is not just about silverware; it’s a tangled story told in playoff rates, losing streaks, net run rates, and wooden-spoon finishes.
Listicles usually stop at “no titles.” A proper, professional assessment goes beyond that. The most unsuccessful IPL team should be identified by a composite view that weights what matters most: trophies, consistent competitiveness, and staying power through different cycles. A team can have a strong win percentage and still lack a title. A team can make playoffs often and still bleed losses over time. The only way to settle the debate is to define the term clearly, rank teams against the same yardstick, and provide the context that raw numbers don’t show.
Methodology: defining an Unsuccess Index that actually makes sense
This analysis evaluates franchises across the full history of the tournament through the latest completed season, with special care to separate active franchises from defunct or short-life teams. Rebrands are consolidated under current names (Delhi Daredevils merged into Delhi Capitals; Kings XI into Punjab Kings). The goal is to be neutral, transparent, and replicable.
Data sources
- Official league records (match results, tables, playoffs, and titles)
- ESPNcricinfo’s Statsguru database for long-range splits and run-rate context
Team categories
- Active franchises with at least one hundred matches: the primary comparison set
- Active new-era franchises with fewer than one hundred matches: listed, not ranked by the composite score
- Defunct franchises: assessed separately to avoid skewing comparisons
Core metrics and weights
- Trophy count: lack of a title has the heaviest effect on perceived failure. Weight 50%.
- Playoff rate: share of seasons reaching the top tier of the table or qualifiers. Weight 25%.
- Win percentage: sustained competitiveness across matches. Weight 20%.
- Wooden spoon finishes: last-place seasons reflect systemic issues, not just variance. Weight 5%.
Unsuccess Index (UI) concept
- UI = 50 for being trophyless, 0 for having at least one title
- Plus 25 × (1 − playoff rate)
- Plus 20 × (1 − win percentage)
- Plus 5 × wooden spoon rate (last-place finishes divided by seasons played)
This yields a score between 0 (perfectly successful) and 100 (maximally unsuccessful). It favors long-term consistency over one-off peaks or dips and keeps the conversation anchored in more than one stat.
Thresholds and fairness checks
- Minimum matches: one hundred for the composite ranking of actives
- Rebrands merged: DC/DD and PBKS/KXIP combined under current names
- Defunct and short-life teams handled in separate tables
- Era context applied to interpret results, not to redefine them
Leaderboards at a glance
Unsuccess Index ranking — active franchises (100+ matches)
- Punjab Kings — Trophyless, low playoff rate, low win percentage band, multiple last-place finishes. Highest composite UI.
- Delhi Capitals — Trophyless, similar win percentage band to PBKS, a comparable count of last-place finishes, slightly better in some playoff windows but still near the top of this list.
- Royal Challengers Bangalore — Trophyless, respectable win percentage and high-scoring aura at home, but a playoff-to-title conversion issue and a heavy loss total over time keep them here.
- Rajasthan Royals — One title under the belt, which removes the 50-point trophyless penalty; however, volatility, low-playoff seasons, and wooden spoons raise their UI relative to their talent pool.
- Sunrisers Hyderabad — A title and a traditionally strong bowling core keep their UI down; not in the “unsuccessful” bracket by any fair measure.
- Kolkata Knight Riders — Multiple titles and an improved recent curve; low UI.
- Mumbai Indians — A trophy-laden resume; very low UI.
- Chennai Super Kings — A trophy-laden resume; very low UI.
- Gujarat Titans — A title early in their existence; not ranked in the primary composite due to sample size but clearly low UI.
- Lucknow Super Giants — New-era consistency in league phases; not ranked in the primary composite due to sample size.
Notes
- The index penalizes trophyless teams heavily by design. Among them, PBKS and DC separate from RCB due to lower win rate bands and more bottom finishes, even though RCB’s lack of a title is a huge talking point.
Teams without an IPL title (active franchises)
- Punjab Kings
- Delhi Capitals
- Royal Challengers Bangalore
- Lucknow Super Giants
Most losses by team (all-time, active franchises)
- Punjab Kings — highest losses total among active teams
- Delhi Capitals — close to PBKS in the losses column
- Royal Challengers Bangalore — large total due to longevity, but balanced by higher win rates in certain eras
- Rajasthan Royals — mid-to-high losses, high variance by season
- Kolkata Knight Riders — heavy volume, net positive in title eras
- Mumbai Indians — high match count but not near the top for losses
- Chennai Super Kings — remarkable balance; far from the top in losses
- Sunrisers Hyderabad — not among the worst for losses
- Gujarat Titans — small sample, low losses
- Lucknow Super Giants — small sample, low losses
Lowest win percentage in IPL history by active franchises (100+ matches)
- Punjab Kings — the lowest win percentage band among long-tenured actives
- Delhi Capitals — a narrow second-worst band
- Rajasthan Royals — middle band, swings by season
- Royal Challengers Bangalore — near or just below a coin flip across eras
- Kolkata Knight Riders — solidly above the midline after title cycles
- Sunrisers Hyderabad — healthy win percentage band, anchored by bowling-first templates
- Mumbai Indians — comfortably above average across eras
- Chennai Super Kings — consistently among the best
Wooden spoon finishes — active franchises
- Delhi Capitals — most last-place finishes among actives
- Punjab Kings — among the top for last-place finishes
- Rajasthan Royals — several last-place seasons in lean cycles
- Royal Challengers Bangalore — fewer last places than narrative suggests
- Others — sporadic last-place seasons tied to injury crises or transition years
Longest losing streaks by franchise
- Pune Warriors — 11 matches
- Delhi Daredevils/Capitals — 11 matches across a tough cycle
- Punjab Kings — long skids in multiple seasons, though not touching the very top
- Others — streaks in the mid-to-high single digits
All-time context for defunct teams
- Pune Warriors — the definitive struggler among defunct teams; the lowest long-run win rate across a sizable short span, double-digit losing streak included
- Kochi Tuskers Kerala — competitive in a tiny sample, then gone
- Deccan Chargers — a title in the cabinet but chaotic form surrounding it, including a basement finish
- Rising Pune Supergiant — short life; one peak season carries legacy esteem
How the Unsuccess Index shifts by era
The league has lived through distinct eras with unique tactical and structural realities. Judging a team without this context misses half the story.
Early seasons
- New-team volatility: Auction structures and talent gaps created boom-bust profiles. Rajasthan won early through innovation and tactical frugality; Delhi had elite talent but fragile balance.
- The PBKS arc: Electrifying batting units repeatedly undermined by unbalanced bowling and late-season fades. Dazzling peaks; thin margins that cut the wrong way.
- RCB under the big guns: Superstar lineups, thin death bowling, and a home ground that magnified both glory and pain.
Expansion and consolidation
- Data trickles turned into data rivers. Teams started using split roles more intelligently: specialist powerplay swing, short-phase finishers, matchup spinners for left-right pairs.
- Delhi’s rebrand era: A necessary identity reset improved talent pathways, but the overcorrection toward youth cycles carried its own volatility. The playoffs were never guaranteed.
- PBKS leaned into retail therapy at auctions: constant churn in captains and coaches. A dangerous franchise on paper, often undone by role duplication and a soft middle under pressure.
Current mega-auction phase and the impact-player rule
- The impact-player rule rewards teams with deep, flexible domestic benches. The franchises with the best scouting and academy pipelines thrive.
- Lucknow mastered the league phase quickly: powerplay discipline, clarity in middle-overs spin, and well-defined finisher roles.
- Gujarat arrived with a plan, unlocked undervalued all-rounders, and solved the finisher puzzle early.
- PBKS and DC fought the same battles in a new rule-set: clarity of roles, late-over bowling depth, and finding a reliable pivot in the middle. Without that, even a massive total can feel 10 short.
What the numbers can’t tell you, but the insiders know
The “unsuccessful” tag becomes a magnet for narratives. The one that sticks the most is about decision-making under stress.
- Auction table temperament: Overpaying for top-order hitters feels good in April, but the engine room of a title campaign is death bowling and adaptive spin. PBKS, more than most, has chased star power up front while leaving thirty balls of chaos at the back end unsolved.
- Captaincy churn: DC and PBKS cycled captains so often that they repeatedly lost tactical memory. A settled leadership group makes on-field choices feel instinctive; churn makes them feel like committee work.
- Risk management in chase: RCB’s high-chase identity often defaults to binary outcomes. When it lands, it looks unbeatable. When it doesn’t, all the blame pools under “no titles.” There’s nuance there: death-overs resources and middle-overs strike rotation have historically been the thinner seams.
- Venue vagaries: Teams that change home bases or split venues lose the accumulated micro-edges of local knowledge—boundary dimensions, cross-breeze patterns, and length trends by end-of-season wear. DC and PBKS have both lived through multi-home seasons that tax continuity.
Deep dives by team
Punjab Kings: the standard-bearer for unrealized potential
At their best, PBKS look like a T20 lab set to “fun.” Top-order fluency, sixes in clusters, a bowling attack that can swing new balls and attack the stumps. The roster often shines under lights—on paper. In practice, PBKS frequently assemble lineups with overlap in batting roles (multiple explosive openers) and under-index on lower-middle elasticity. When the powerplay under-delivers, that combination leaves too much to do in the last five overs, and it shows in the net run rate during tight campaigns.
Defining features across eras
- High turnover: coaches, captains, and overseas cores change often
- Tug-of-war between continuity and the next shiny object at auctions
- Inconsistent death bowling investments; a heavy burden on one specialist
- Home shifting between venues with different character, limiting consistent home edges
Signature symptoms
- Season-long negative NRR despite high aggregate runs
- Multiple last-place finishes and a chronic pattern of falling short of the top four by a win or two
- The most losses among active teams and the lowest long-term win-rate band among long-tenured sides
Delhi Capitals: a talent factory with turbulence
No franchise has produced more “this will be their season” predictions. There’s a reason for that. Even through down cycles, DC have invested in youth and pace. The problem has been continuity and balance. Top-order quality has come in waves, but rebuild phases have often coincided with brittle middle orders and injuries to key quicks.
Defining features across eras
- Overreliance on one or two world-class performers to paper over structural gaps
- A significant tally of last-place finishes, magnified by long losing streaks in transition cycles
- A rebrand that did improve scouting and role clarity, but not consistently enough to exit the trophyless bracket
Signature symptoms
- Losing streaks that spiral from one tactical weakness (powerplay collapses or death-overs hemorrhage)
- Net run rate whiplash: heavy wins offset by heavy losses, never quite knitting into the calm regularity a title run requires
- Playoffs tasted but not converted, leaving the overall perception closer to PBKS than to their better stretches suggest
Royal Challengers Bangalore: the paradox of power
RCB are the strongest argument for a layered definition of unsuccessful. Trophyless, yes. But the brand of cricket they’ve played and the gates they’ve opened for the league’s entertainment quotient are second to none. Every era has had a batting talisman. What they haven’t always had is a bowling attack built to absorb the battering of their home conditions: a small outfield, true pitch, and a compulsively aggressive batting approach.
Defining features across eras
- Batting identity as the front-door strategy; bowlers asked to adapt to scoreboard pressure
- A recurring thinness at death with the ball, especially when overseas slots are consumed by batting stars
- Playoff appearances at a healthy clip compared to other trophyless sides
Signature symptoms
- A loss ledger that’s big because of longevity, but a win-rate band closer to the midline than their detractors admit
- Knockout-stage fragility: exits that prompt a microscope over fielding lapses, matchups avoided, or bowling plans that lacked a second gear
- Seasons where they score enough to win five titles and still finish short because of three critical overs that go sideways
Rajasthan Royals: volatility as a way of life
An early title stamped this franchise with a reputation for hustling smarter than their budget. The scouting pipeline remains admirable, especially with under-the-radar domestic quicks and utility batters. Yet the long arc has been bumpy. Royals mix peak strategy with transitional disarray. Their win percentage sits in the middle band, dragged down by rebuilds and injury-hit campaigns.
Defining features across eras
- Strong domestic scouting, often ahead of the market
- Overseas picks that either elevate the whole outfit or don’t mesh quickly enough
- Wooden spoons in rough cycles, offset by seasons where they look like the smartest team in the room
Signature symptoms
- Chasing wobble in slower conditions
- Overdependency on one set role (e.g., leg-spin control) that, when nullified, opens multiple leaks
- NRR swings that mirror their high-variance batting strategy
Sunrisers Hyderabad: bowling-first DNA with modern tweaks
Not an unsuccessful team in any reasonable framing, but key to the conversation because they frequently determine the ceiling for PBKS and DC. When SRH are in their groove, they compress oppositions with powerplay wickets and surgical middle-overs spin. The batting template has modernized over time, adding six-hitting gears without surrendering control.
Defining features across eras
- Disciplined use of new-ball swing and defensive fields
- Matchup mastery in the middle overs
- A win-rate band that lifts them out of the mid-table morass even in average seasons
Gujarat Titans and Lucknow Super Giants: the new-case baselines
- Titans established a low-UI baseline quickly, showing how clarity of roles and undervalued all-rounders can build a title-ready side fast.
- Lucknow deliver league-phase excellence through conservative powerplay batting and reliable bowling blueprints, even without a deep trophy cabinet. Their UI remains neutral-to-low thanks to early consistency.
Situational analytics: where unsuccessful teams actually lose ground
Home and away realities
- Delhi’s home surfaces traditionally slow through the season, demanding skill against cutters, back-of-length variations, and low-bounce control. Teams that refuse to evolve from a flat-deck playbook fall into repeatable mistakes. Across cycles, DC have overhauled personnel rather than maximizing a bespoke plan that matches the square.
- PBKS split homes and adopted alternate bases more often than most. That dilutes local mastery—boundary angles, preferred ends for specific bowlers, dew patterns. The result is fewer automatic tactical wins at home.
- RCB’s home is both blessing and curse. The batting stats are gaudy, the crowds raucous, but defending totals needs elite death bowling and boundary protection strategies that survive on pure execution. Too often, the last 20 balls with the ball decide their seasons.
Losing streak anatomy
Teams don’t freefall only because of form. They freefall because three or four small edges align against them.
- Powerplay stalls: Dot-ball pressure births panic singles and soft dismissals. DC and PBKS have lived this repeatedly when openers get pinned.
- Overs 16–20 with the ball: This is where PBKS historically lose points. One mis-executed yorker turns into an over that blows out the NRR and the game.
- Fielding lapses: The unsuccessful tag sticks longer when catches go down at deep midwicket and long-off in chases under lights. Marginal teams can’t afford to give away 10–15 runs in the field.
- Matchup misfires: Persisting with a left-arm spinner to a set left-hander, or refusing to bowl the hit-the-deck pacer to a hitter who thrives on length. Smart teams milk these mistakes.
Tactical diagnosis by department
Powerplay batting
PBKS and DC both suffer when their first-wicket stand becomes a hit-or-miss proposition. The best sides in the league build redundancy: a high-skill anchor who rotates strike at 130-plus and an enforcer who clears the ring without burning too many dots. Unsuccessful teams swing between two anchors or two enforcers, rarely the balanced pair.
Middle-overs control
Spin combinations matter. The title sides stack complementary spinners—left-arm orthodox to the right-handers, leg-spin to the lefties, and a match-up offie who can bowl in the powerplay if needed. PBKS and DC oftentimes run one quality spinner with role confusion around him, which leaks control in overs 7–14.
Death overs
You can’t fake yorkers. The outfits frequently called unsuccessful often rely on one bowler for the last two overs. When he misses, the over goes for 18, and the postmortem writes itself. Contrast that with elite teams who split the last four across two specialists and one smart matchup over.
Chasing temperament
RCB’s story in chases shows the cost of a binary approach in tight games. A calmer 6–8 over window with calculated risk would change their table placement across multiple seasons. The brand is intoxicating; the variance is brutal.
How the Unsuccess Index would score sample teams
Note: The following are directional, illustrative summaries, not raw math dumps. The components reflect the factors driving each rank.
Punjab Kings
- Trophy penalty: full
- Playoff rate: low to moderate
- Win percentage: lowest among long-tenured sides
- Wooden spoons: multiple
- Composite: highest UI among active franchises
Delhi Capitals
- Trophy penalty: full
- Playoff rate: moderate, improved with rebrand but uneven
- Win percentage: low band, marginally better than PBKS across some stretches
- Wooden spoons: most among actives
- Composite: near-equal UI to PBKS, nuanced edge decided by marginal win-rate and losses ledger
Royal Challengers Bangalore
- Trophy penalty: full
- Playoff rate: relatively healthy
- Win percentage: around midline, better than PBKS/DC
- Wooden spoons: fewer than perception
- Composite: lower UI than PBKS/DC due to competitiveness, still elevated by trophyless status
Rajasthan Royals
- Trophy penalty: zero
- Playoff rate: inconsistent across cycles
- Win percentage: middling with high volatility
- Wooden spoons: present
- Composite: mid-UI, inflated by variance rather than a structural inability to win
Sunrisers Hyderabad
- Trophy penalty: zero
- Playoff rate: steady to strong
- Win percentage: solid
- Wooden spoons: sparse
- Composite: low UI
Key tables
Active trophyless franchises
- Punjab Kings — trophyless, multiple last-place finishes
- Delhi Capitals — trophyless, most wooden spoons
- Royal Challengers Bangalore — trophyless, strong batting identity, playoff appearances
- Lucknow Super Giants — trophyless, early stability in league phases
Active franchises with the most losses (rank only)
- Rank 1: Punjab Kings
- Rank 2: Delhi Capitals
- Rank 3: Royal Challengers Bangalore
- Rank 4: Rajasthan Royals
- Rank 5: Kolkata Knight Riders
- Rank 6: Mumbai Indians
- Rank 7: Chennai Super Kings
- Rank 8: Sunrisers Hyderabad
- Rank 9: Gujarat Titans
- Rank 10: Lucknow Super Giants
Active franchises with the lowest win percentage (100+ matches)
- Punjab Kings — lowest band
- Delhi Capitals — next lowest band
- Rajasthan Royals — middle band
- Royal Challengers Bangalore — around the midline
- Kolkata Knight Riders — above midline
- Sunrisers Hyderabad — healthy band
- Mumbai Indians — strong band
- Chennai Super Kings — elite band
Wooden spoon finishes by active franchise (count-led overview)
- Delhi Capitals — the highest count among actives
- Punjab Kings — among the highest
- Rajasthan Royals — present in multiple cycles
- Royal Challengers Bangalore — occasional
- Others — sporadic, often during transition
Longest losing streaks by team (top landmarks)
- Pune Warriors — 11
- Delhi Daredevils/Capitals — 11
- Others — seven to nine in rough cycles
Era snapshots that shaped reputations
The early chaos
- Rajasthan stole edges through clever roles and undervalued domestic talent. Everyone else faced the auction learning curve.
- Delhi ran hot and cold. A roster that read like an all-star list never quite settled on a role-balanced XI through multiple phases.
- PBKS chased firepower and found it, but the late overs—both batting and bowling—kept slipping away.
The middle consolidation
- The smartest teams leaned into matchup science. SRH built a bowling-first identity; KKR learned to control the middle overs; MI and CSK institutionalized continuity.
- DC re-energized their scouting and gave youth a runway. The result: playoff pushes that raised expectations, without breaking the trophy drought.
- PBKS kept cycling captains and coaches. The post-match language was about intent; the recruitment rarely fixed the death-overs gap.
The current mega-auction era
- Depth matters more than ever. The impact-player rule rewards sides with redundancy in domestic batting and bowling. If one thread snaps, elite teams pull another.
- LSG and GT arrived with clarity. They built squads where the number seven can win games. That is the template.
- DC and PBKS still live on the edge. They have match-winners but keep searching for the glue guy around overs 12–17 with bat and ball.
Narratives that refuse to die, with the data behind them
RCB as the emblem of heartbreak
- Trophyless status alone places them in many fan debates as the most unsuccessful. The data rebuts that: better win percentage bands and playoff rates than DC/PBKS in aggregate.
- The choke label is overused. A more precise verdict: a resource imbalance between batting and high-leverage bowling. In a venue where 180 is par, bowlers decide titles.
DC’s promise vs. product
- The rebrand energy created a better recruitment culture. Results improved, but not enough to exit the trophyless bracket or to erase the league’s highest count of last-place finishes among actives.
- The long losing streak co-record is the scar tissue that inflates the perception of failure.
PBKS and the talent paradox
- No fanbase has felt the edges of thin margins more often. PBKS lose a disproportionate number of five-run games and two-over swings.
- The fix has always been the same: build a reliable back five with the ball, and one middle-order consolidator who can bat through a collapse without dragging the rate below parity.
Definitive answers without hedging
- The most unsuccessful IPL team among active franchises
Punjab Kings lead on the composite Unsuccess Index because they combine the trophyless penalty with the lowest win-rate band among long-term teams, the most losses, and a significant count of last-place finishes. - The ipl team with most losses
Punjab Kings have accrued the most all-time losses among active franchises. - The lowest win percentage among long-tenured actives
Punjab Kings sit at the bottom band, with Delhi Capitals a narrow second. - Teams that never won the IPL
Punjab Kings, Delhi Capitals, Royal Challengers Bangalore, Lucknow Super Giants. - The franchise with the most wooden spoon finishes
Delhi Capitals have finished last more often than any other active franchise. - The longest losing streak in league history
Pune Warriors and Delhi Daredevils/Capitals share the record at eleven straight defeats.
Contextual comparisons: unsuccessful vs successful
- A team with a mid-table win percentage can win a title if it peaks in the playoffs; that does not erase chronic issues across seasons. Titles matter most in memory, but the Unsuccess Index ensures that consistent underperformance across years is quantified.
- Mumbai Indians and Chennai Super Kings demonstrate the inverse: even with down years, their title counts and playoff conversion keep their UI low.
- Kolkata Knight Riders show how a franchise can change tiers by fixing the middle overs and trusting role specialists.
What would change these rankings
- Trophies reset narratives overnight by wiping out the 50-point penalty in the index.
- A two- or three-season run of playoff qualification lifts the playoff-rate component and usually drags the win percentage up.
- Reducing last-place finishes matters less in weight but signals structural repair.
Scouting and talent pipeline notes that separate winners from strugglers
- Elite teams over-index on domestic bowling depth. That’s where the value is. Overs 16–20 from two different domestic options is how you survive the business end of a season.
- Smart overseas picks are not just about stardom; they’re about stackable skills. A left-handed finisher who can bowl two overs of cutters is better than an extra top-order hitter for most rosters.
- Developmental batting: Successful sides invest in players who can maintain 140 strike at a 30 average in the middle. It’s the hardest role. Unsuccessful teams fill it last.
Case studies in pivotal matches and turning points
- RCB’s infamous collapses live rent-free in the culture, but not enough is said about matches where 20 good balls with the ball turned titles. Often, it’s not the 49-all-out mythos; it’s one over where the plan to a left-hander at death never existed.
- DC’s long losing stretch included games where they out-bowled opponents but couldn’t find the run-a-ball 30 in a chase of 150. That’s recruitment telling on itself.
- PBKS’s signature heartbreaks are two-over windows: a set batter dismissed and the next two overs yielding single digits, followed by a 20-run concession at the death.
Rebrands and defunct teams: why they matter for fair comparisons
- Delhi Daredevils to Delhi Capitals: The data rolls up because the cricket is continuous. Perception improves post-rebrand, but the composite score still feels the weight of older seasons.
- Kings XI to Punjab Kings: The identity changed; the outcomes did not change enough. The index punishes consistent underperformance more than any nametag can fix.
- Deccan Chargers to Sunrisers Hyderabad: New ownership, new blueprint. Chargers’ turbulence sits in the defunct lane; SRH have their own, healthier arc.
Sustainable fixes for the usual suspects
- Clarity in the middle overs: lock a domestic middle-order player with a clear lane—rotate hard, target one bowler, and protect the finisher. Too many teams ask three people to do one person’s job.
- Death-overs redundancy: two bankable options, not one. Titles come from overs 17 and 19 as much as 20.
- Stable leadership: pick a captain-coach pairing and give them two cycles. Every reset taxes points.
Editorial verdicts
- Most unsuccessful ipl team, active set
Punjab Kings. A painful conclusion for a passionate fanbase, but an honest one in data and context. - Least successful ipl team, all-time defunct set
Pune Warriors. Even accounting for a limited lifespan, the depth and length of the losing run make the case straightforward. - Which team is worst in ipl history, with a match-threshold caveat
- For active, long-tenured franchises, Punjab Kings by composite index.
- For defunct or short-life teams, Pune Warriors across most core metrics.
- Trophyless ipl teams that are closest to shedding the label
- Royal Challengers Bangalore, courtesy of more frequent playoff entries and a win-rate band around the midline. Fix death-overs bowling for a full season, and the script flips.
- Lucknow Super Giants, through consistency in league phases and a defined bowling identity.
Notes for readers seeking deeper splits
- Home/away splits: DC’s home demands low-pace hitting smarts and cutters; PBKS’s split homes hinder durable edges; RCB’s home inflates batting and magnifies death-overs bowling quality.
- Net run rate as a lie detector: Teams that frequently finish with a negative NRR despite a near-even win-loss record are usually one death over away from mid-table heartbreak. PBKS and DC have lived there.
Refresh cycle and reliability
This page is updated after each season. The Unsuccess Index adjusts in real time as playoff rates, win percentages, and wooden spoon counts move. Without hard-coded years, the conclusions stand as a living, data-backed summary.
Key takeaways
- Unsuccessful is not just about trophies. It’s a four-part composite: titles, playoff rate, win percentage, and last-place frequency.
- Among active franchises with long tenures, Punjab Kings lead the “most unsuccessful” debate by the numbers, with Delhi Capitals close behind.
- Royal Challengers Bangalore are trophyless but not the statistical cellar; their competitiveness keeps them above DC and PBKS on the index.
- Pune Warriors remain the all-time cautionary tale among defunct teams, with a double-digit losing streak and the weakest win-rate band.
- Era context matters, but role clarity, death-overs redundancy, and stable leadership are the timeless levers that separate serial winners from chronic underachievers.
Closing perspective
Fans live in the extremes—ecstasy for a last-over heave that clears cow corner, despair for a half-volley served up with the game on a string. Teams live in the middle—tactics, development, repetition. The most unsuccessful IPL team isn’t cursed; it’s typically one or two decisions away, repeated across seasons, from rebalancing the entire arc of its history. Titles reward long spells of correct, boring choices wrapped around twelve magic balls. Punjab Kings, Delhi Capitals, and Royal Challengers Bangalore stand at different distances from that truth. One trophy recalibrates everything. Until then, the Unsuccess Index holds the conversation to the same standard for everyone.